Describe Image & Retell Lecture: 2 Templates You Can Use Under Pressure
Hello future 90-scorers! I have seen so many brilliant students walk into the PTE test center and freeze the second a complex chart appears on the screen. Their heart starts racing, they start stuttering, and suddenly their Speaking score takes a massive hit.
If this is you, I have good news: The PTE AI is not looking for a data analyst. It is looking for a fluent speaker. I always tell my students, “Structure > Content > Accuracy.” If you sound confident and keep your “flow” going, you can get a perfect score even if you miss half the details in the image.
Today, I’m giving you the two “Golden Templates” that my students use to stay calm, sound natural, and earn maximum points with zero panic.
What Earns Points vs. What Wastes Time
Before we look at the templates, we need to clear up the biggest myth in PTE Speaking: the idea that you have to be “accurate.”
The Point Earners (Do This!):
-
Continuous Flow: The AI marks you on “Oral Fluency.” This means no long pauses, no “ums” and “ahs,” and absolutely no self-correction.
-
Confidence: Speaking at a steady, moderate volume and pace tells the AI you are a proficient speaker.
-
Key Keywords: The AI looks for keywords related to the image or lecture. You don’t need the exact numbers; you just need the labels.
The Time Wasters (Stop This!):
-
Quoting Exact Numbers: Saying “The value was 45.678 percent” is a waste of time and increases your risk of stuttering. Say “The value was high” instead.
-
Searching for “Deep Meaning”: You don’t need to explain why the trends are happening. Just describe what you see.
-
Silent Thinking: If you stay silent for more than 3 seconds, the microphone will turn off, and you’ll get a zero for that task.
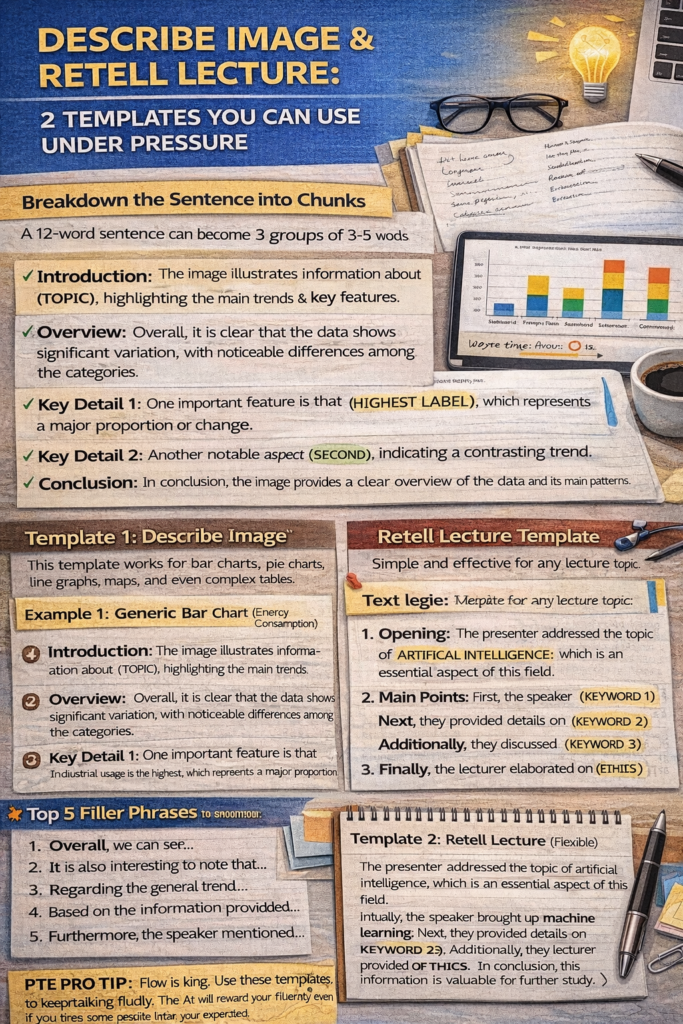
Template 1: Describe Image (Universal)
This template works for bar charts, pie charts, line graphs, maps, and even complex tables.
-
Introduction: “The image illustrates information about, highlighting the main trends and key features.”
-
Overview: “Overall, it is clear that the data shows significant variation, with noticeable differences among the categories.”
-
Key Detail 1: “One important feature is that [Highest Category/Label], which represents a major proportion or change.”
-
Key Detail 2: “Another notable aspect is, indicating a contrasting or supporting trend.”
-
Conclusion: “In conclusion, the image provides a clear overview of the data and its main patterns.”
Example 1: Generic Bar Chart (Energy Consumption)
“The image illustrates information about energy consumption across different sectors, highlighting the main trends and key features. Overall, it is clear that the data shows significant variation, with noticeable differences among the categories. One important feature is that industrial usage is the highest, which represents a major proportion. Another notable aspect is residential demand, indicating a contrasting trend. In conclusion, the image provides a clear overview of the data and its main patterns.”
Example 2: Generic Pie Chart (Global Languages)
“The image illustrates information about the distribution of global languages, highlighting the main trends and key features. Overall, it is clear that the data shows significant variation, with noticeable differences among the categories. One important feature is that English is the most spoken language, which represents a major proportion. Another notable aspect is the category of other languages, indicating a supporting trend. In conclusion, the image provides a clear overview of the data and its main patterns.”
Template 2: Retell Lecture (Flexible)
Retell Lecture is all about keywords. While the lecture plays, jot down 5-8 strong keywords (nouns or short phrases). Use this template to “glue” them together.
-
Opening: “The presenter addressed the topic of, which is an essential aspect of this field.”
-
Point 1: “Initially, the speaker brought up [Keyword 1] and provided some interesting insights regarding [Keyword 2].”
-
Point 2: “Subsequently, the lecturer provided details into [Keyword 3] and conversed about [Keyword 4].”
-
Closing: “Finally, the speaker elaborated on [Keyword 5] and concluded that this information is valuable for further study.”
Example Output: Technology Lecture
“The presenter addressed the topic of artificial intelligence, which is an essential aspect of this field. Initially, the speaker brought up machine learning and provided some interesting insights regarding neural networks. Subsequently, the lecturer provided details into automation and conversed about future job trends. Finally, the speaker elaborated on ethics and concluded that this information is valuable for further study.”
Top 5 Filler Phrases (The “Fluency Glue”)
If you get stuck or your mind goes blank for a second, don’t stay silent. Use these “filler phrases” to keep the clock moving while your brain catches up. These sound natural to the AI and won’t hurt your score.
-
“Overall, we can see…” (Perfect for transitioning to a trend).
-
“It is also interesting to note that…” (Gives you 2 seconds to find a new label).
-
“Regarding the general trend…” (Good for buying time in graphs).
-
“Based on the information provided…” (A safe way to start any sentence).
-
“Furthermore, the speaker mentioned…” (The best way to jump to your next keyword in Retell Lecture).
Remember: In Speaking, flow is king. If you keep talking using these templates, the AI will reward your fluency, and you’ll find yourself hitting that 79+ target much faster than you expected.
Happy practicing!